
Stocks at All-Time Highs. Here's Why It's Not Complicated.
Every time the market notches a new record, the same question floods the headlines. How can stocks be this high?
I've been getting it a lot lately. But it's the wrong question.
The better question is: what drives stock prices over time? The answer isn't sentiment, it isn't momentum, and it certainly isn't luck. It's earnings. Corporate profits. The actual money businesses make. I've written about this here, here, and here.
Here's what the data shows. Since 2023, S&P 500 earnings have grown roughly 10% per year. Revenue is up. Margins have held. Companies, particularly in technology and healthcare, have continued to compound at a remarkable rate. When profits grow, stock prices follow. It's not magin, its simple arithmetic. The S&P 500's next 12 months Earnings Per Share (EPS) is currently $336 per share, that's up 9% since the end of last year and 5.8% over the past eight weeks (since the crisis began). And, 2027 expectations are 16% higher from where we are today.

Don't believe me? Run the numbers. The year-to-date return tells you everything you need to know. Profit expectations are up. Multiples are down. The market is higher because earnings are higher, not because investors have gone irrational.
Let me put some numbers to it. The forward P/E on the S&P 500 is currently 21.3x (see chart below). That's down from 22.2x at the end of 2025, and well off the 23.5x peak we saw back in October. At the bottom of the recent pullback on March 30, it had compressed all the way to 19.3x.
Think about that for a second. The index is at a new all-time high, yet you're paying less for every dollar of earnings than you were six months ago.
Why? Because real rates have jumped. Markets have priced in a Fed that's in no hurry to cut, with inflation still running warm. That's kept a lid on valuations even as earnings expectations have climbed. The two forces have been pulling in opposite directions, and earnings have been winning. This is exactly what you would expect a market to do.

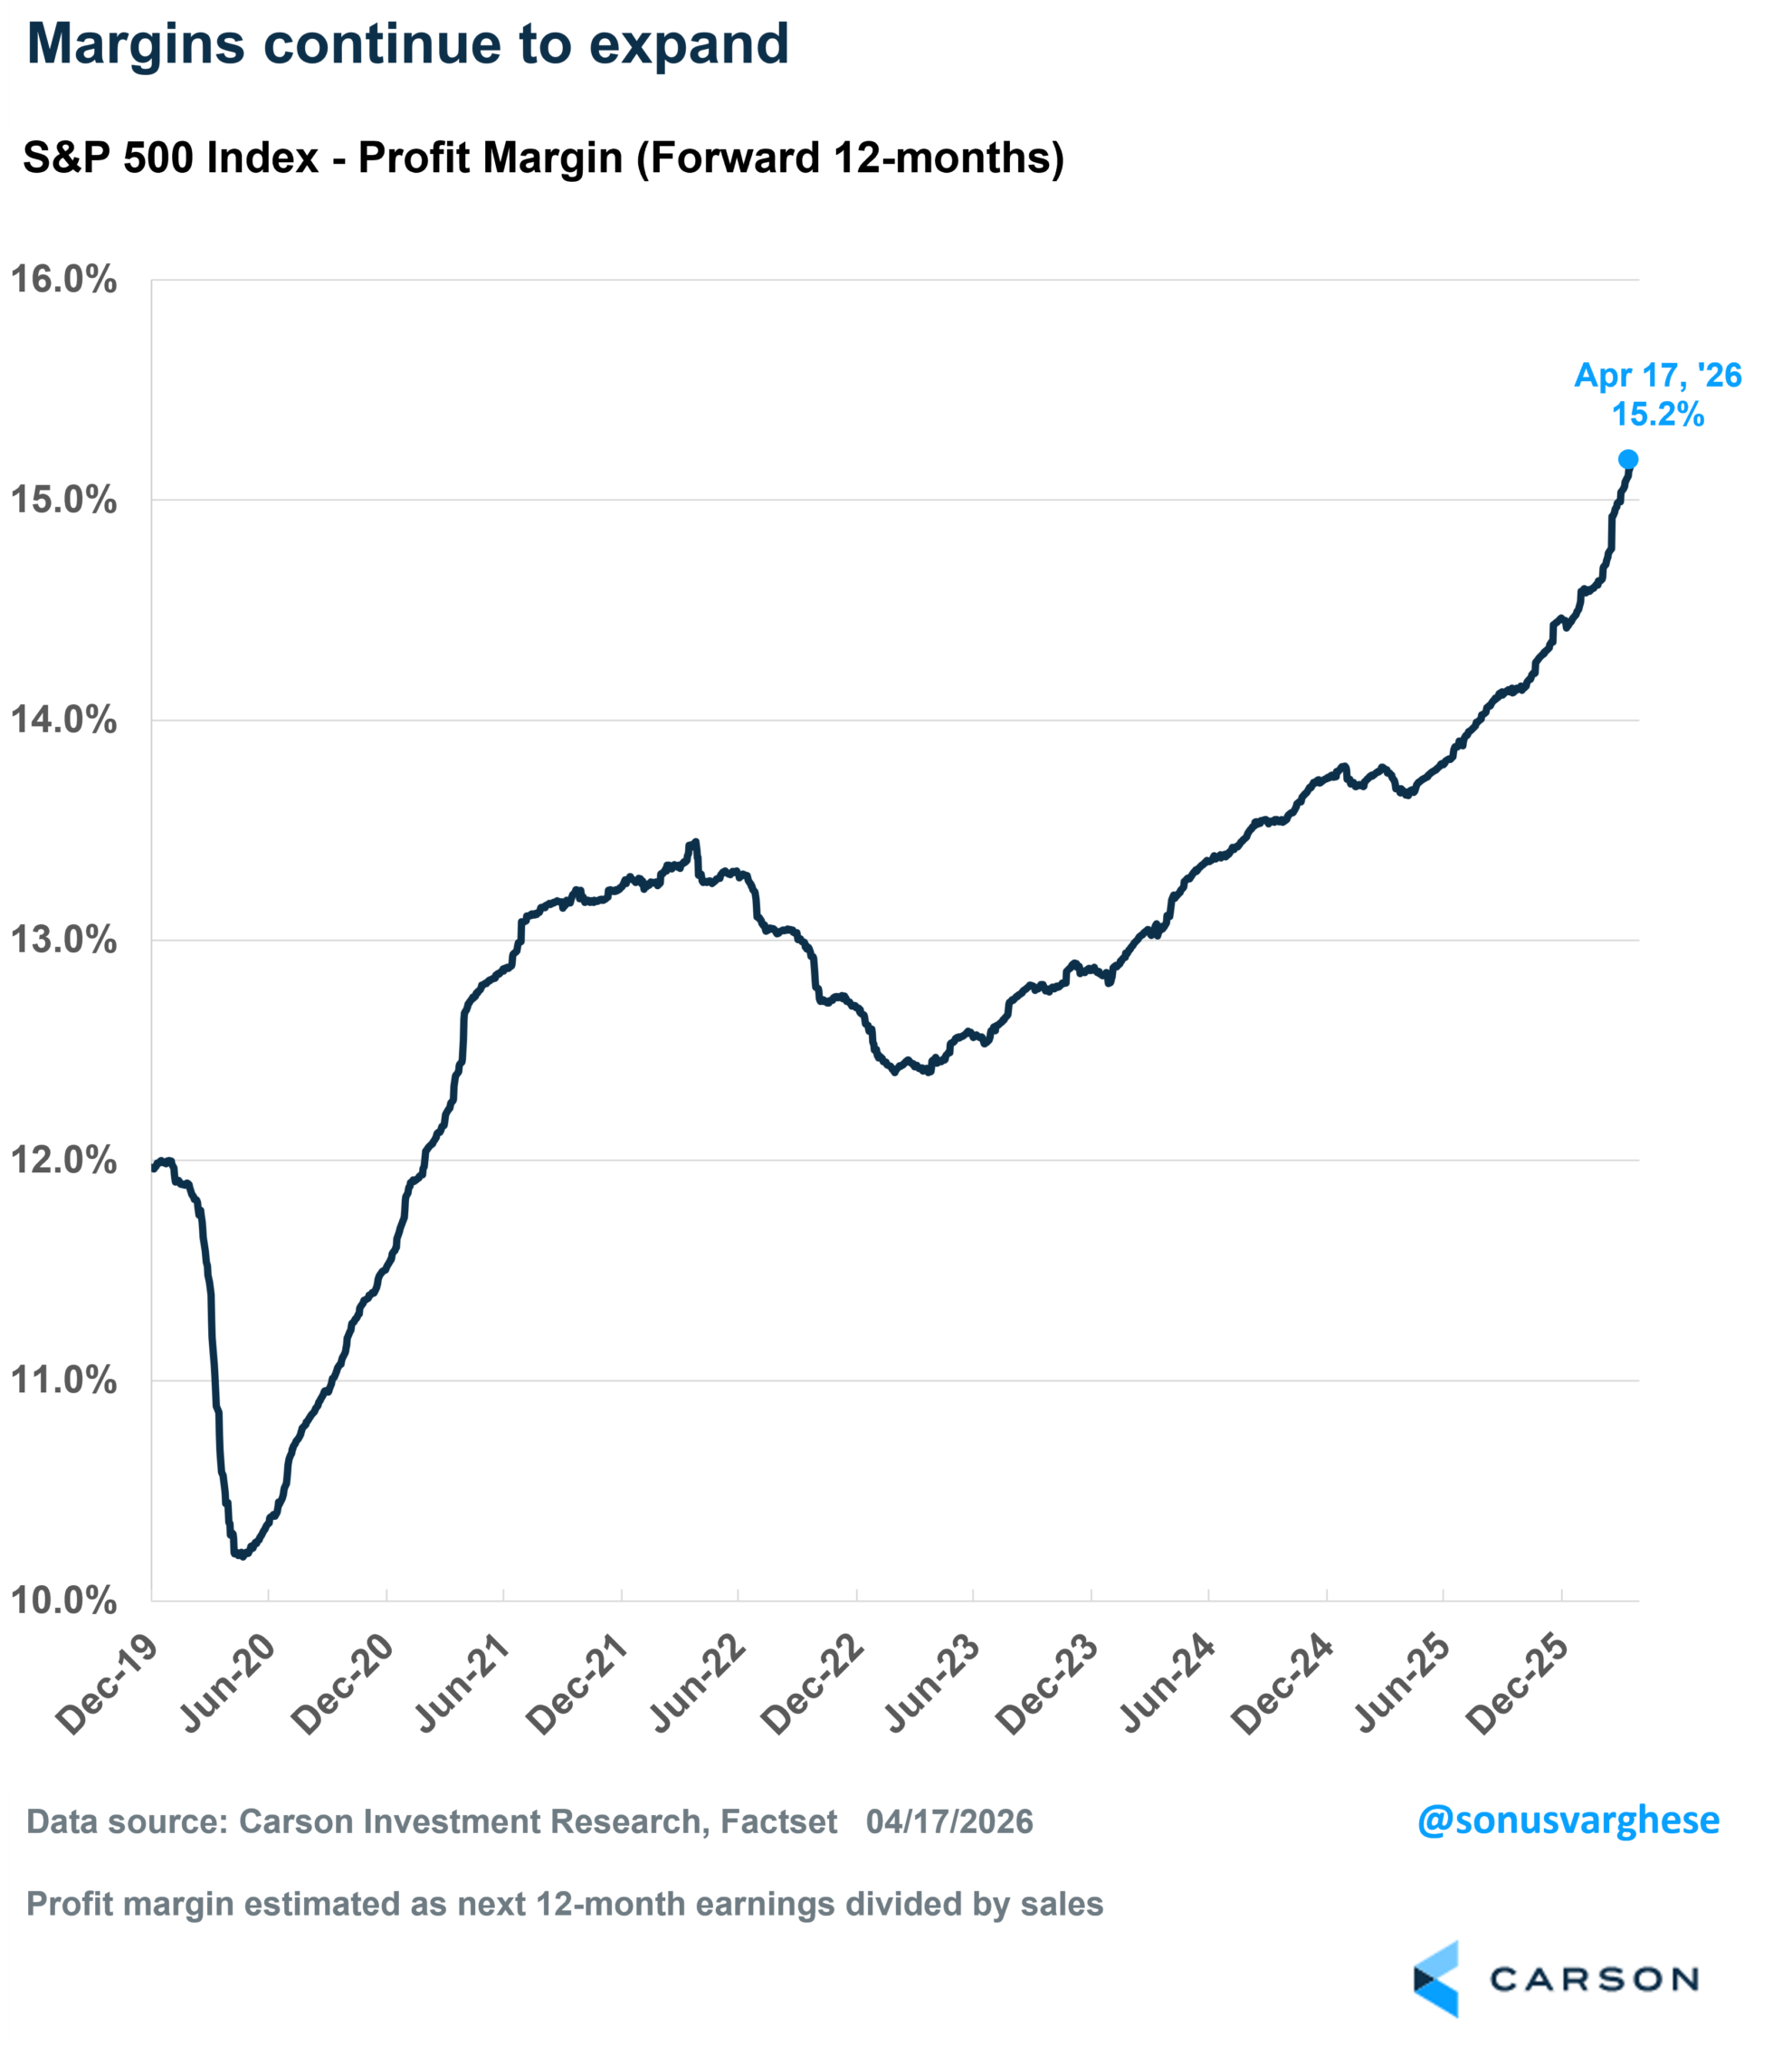
The economy has played its part too. Consumer spending has stayed resilient. Unemployment remains low. The much-predicted recession never arrived. And yet, and here's the part that frustrates people, investors spent the better part of two years waiting for the collapse that didn't come, sitting in cash, watching the market climb. Meanwhile, over and above what I have illustrated above, corporate profit margins continue to expand.
It feels super uncomfortable, I get it, but all-time highs aren't a warning sign. Historically, they're one of the most reliable buy signals we have. In fact, data going back to 1950 tells us that buying at all-time highs produces returns that are as good, or better, than buying at any other time. When you invest at an all-time high vs any random day, here's the average forward return:

All-time highs have historically delivered better returns than average, not worse.
And here's why - All-time highs cluster in bull markets, which tend to have momentum. The S&P 500 has hit over 1,200 all-time highs since 1950, roughly one every two weeks on average. If you'd avoided investing every time the market was at a high, you'd have been sitting in cash for a huge chunk of the best years in market history.
The lesson is the same as it always is. The market doesn't need your permission to go up. It doesn't wait for the all-clear. By the time the narrative feels comfortable, the move is already well underway.
Take the long view.
Ready to grow your wealth?
Let's talk. One call. No risk. Just a way to see if we're a good fit.